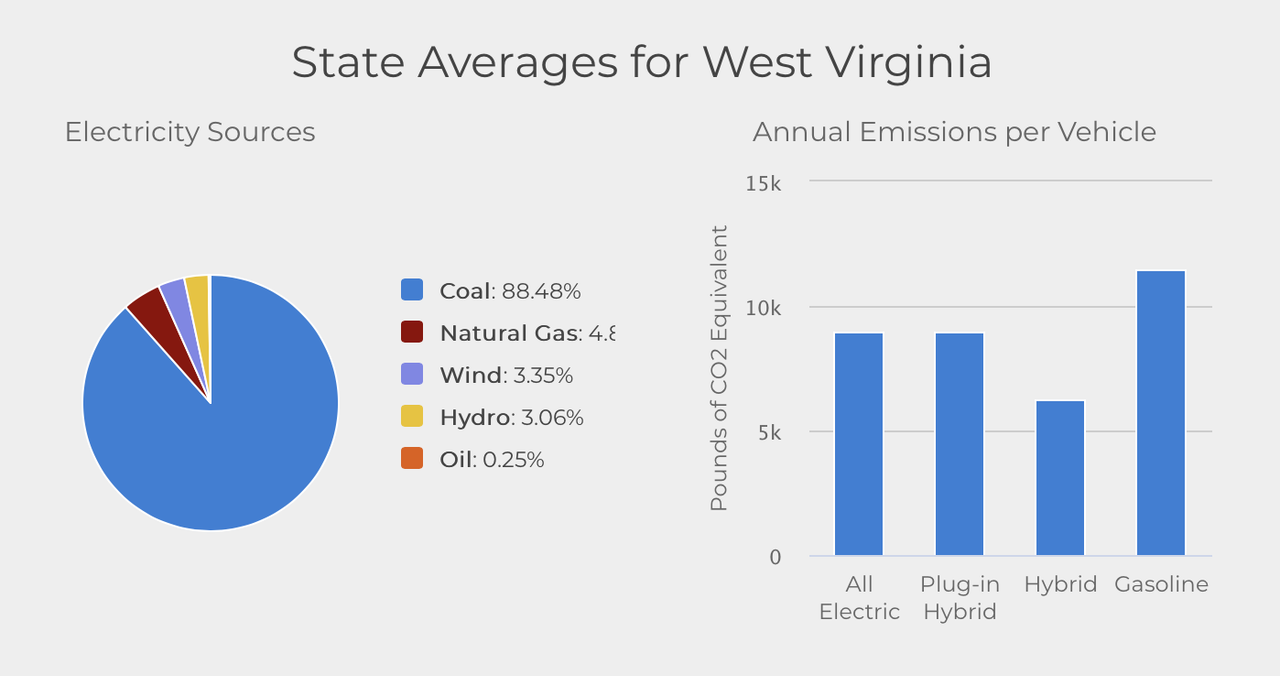
## In 6 US states, hybrids are cleaner than all-electric cars
The 6 states are West Virginia, Wyoming, Kentucky, Missouri, Utah and Indiana.
*tl;dr This is largely due to reliance on coal for energy.*
### Wait, what?
See for yourself in this nice interactive chart published by
the US Department of Energy:
https://afdc.energy.gov/vehicles/electric_emissions.html
The document publishes some assumptions:
- A standard internal combustion engine (ICE) car achieves 24.3 miles per gallon (mpg)
- A hybrid car gets 44.4 mpg
**So we can see that a hybrid emits $54.7\\%$ as much as ICE cars.**
We can also figure out the relative pollution caused by
all-electric vehicles (EVs) by considering the sources of the electricity.
I couldn't find it in the assumptions and the linked reports
were a bit too long for me to read. Luckily, the equation for
determining the equivalent amount of emissions was in the JavaScript,
so I ripped it from there:
$$
\\%ICE = 0.64 \times oil\\% + 0.38 \times gas\\% + 0.83 \times coal\\%
$$
In Utah, for example, 61.47% of its electricity comes from burning coal and
another 25.4% comes from natural gas.
**So Utah's EV cars emit about $0.83 \times 61.47\\% + 0.38 \times 25.4\\% \approx 60.7\\%$
as much as ICE vehicles. More than hybrids!**
Because Utah burns so much coal for electricity,
it's actually better for the environment to rely on
a combustion engine to make the electricity for you.
### Appendix
#### List of States
Here's the full list of states by EV emissions.
| State | % of ICE emissions from EV cars |
| ----------- | ----------- |
|WV | 75.45%|
|WY | 68.40%|
|KY | 65.93%|
|MO | 62.70%|
|UT | 60.74%|
|IN | 58.91%|
|HI | 52.70%|
|ND | 49.00%|
|OH | 48.15%|
|WI | 45.74%|
|NM | 44.76%|
|NE | 43.99%|
|CO | 42.77%|
|DE | 38.05%|
|MS | 36.35%|
|AR | 36.30%|
|MI | 35.54%|
|RI | 34.95%|
|AK | 34.92%|
|FL | 34.60%|
|TX | 33.78%|
|LA | 32.68%|
|MT | 31.75%|
|US | 31.72%|
|NV | 29.14%|
|MA | 29.03%|
|AL | 28.63%|
|GA | 28.54%|
|PA | 28.43%|
|MN | 28.15%|
|KS | 28.13%|
|AZ | 28.08%|
|NC | 26.78%|
|VA | 26.28%|
|OK | 25.81%|
|DC | 24.64%|
|IA | 24.37%|
|TN | 23.03%|
|MD | 22.66%|
|CT | 21.63%|
|NJ | 20.36%|
|IL | 20.12%|
|SC | 19.98%|
|CA | 18.26%|
|NY | 15.45%|
|OR | 13.08%|
|SD | 10.68%|
|NH | 9.07%|
|WA | 8.40%|
|ID | 7.96%|
|ME | 7.14%|
|VT | 0.06%|
#### Data Sources
If you're interested in playing with this data,
you can find a publicly available link
embedded within the widget above [here](https://developer.nrel.gov/api/eia-summaries/v1/electricity-sources?api_key=0IeT1u1Z7KknN0tWI1wALEJ7mmpqhiZ0gQMM60IA).
Here's the Python 3 code I used to generate the chart above:
```
import json
with open('fuel_by_state.json') as f:
d = json.loads(f.read())
o = []
for k in d:
l = d[k]
coal = l['coal_percent'] if 'coal_percent' in l else 0
oil = l['oil_percent'] if 'oil_percent' in l else 0
gas = l['gas_percent'] if 'gas_percent' in l else 0
rel=0.64 * oil + 0.38 * gas + 0.83 * coal
o.append((k, rel))
o = sorted(o, key=lambda x: -x[1])
for l in o:
print(f"|{l[0]} | {l[1]:.2f}%|")
```